THE total yield of almonds from an orchard is the sum of the production of each individual tree.
Some trees achieve their potential while others don’t.
Yield mapping can be used to provide a comparative view of tree performance along and between rows.
Typically, almonds are shaken from the tree and swept into rows and once sufficiently dry they are picked up by a harvester.
The sweeping process blends the almonds from neighbouring trees into a relatively uniform continuous pile of almonds.
During sweeping, a fan is used which blows almonds across the drip lines from one side of the tree to the other.
Hence, yield mapping may inherently show higher yields on one half of the tree than the other.
There are several methods which can be employed to measure almond yield.
Firstly, the reservoir cart towed by the harvester can be fitted with load cells and directly measure mass gain during harvest.
However, if the yield variation along a row is to be measured, the harvester must stop its harvesting to unload or else a negative mass addition will result.
A second method is to place a weighing or vision-based inspection belt between the harvester and the reservoir cart.
This requires extensive modifications to the harvester to allow its installation.
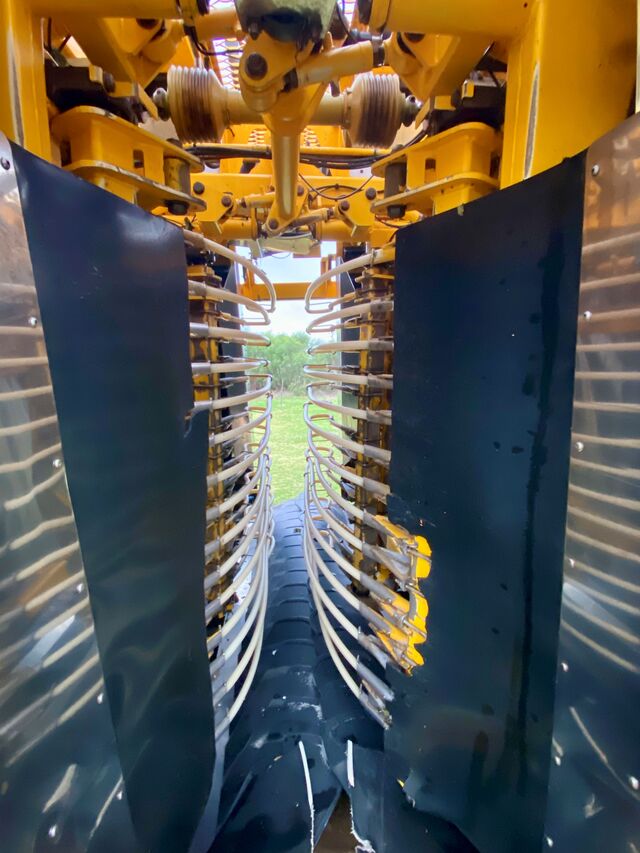
A third method, as presented in this article, places a LiDAR (light detection and ranging) sensor pointing rearward from the harvester into the flow of almonds that are being thrown from the harvester into the reservoir cart (Figure 1).
This article reports on data collected in 2024 by two Ag-IQ Almond Yield Mappers fitted to two self-propelled harvesters: one on a commercial almond farm at Murtho, South Australia, and the other at the Almond Board of Australia’s Almond Centre of Excellence (ACE).
For almond yield mapping there are several measurements which must be recorded.
Position
For yield mapping, the position of the harvester must be known and recorded with the yield data.
The manufacturers of GPS systems are currently claiming 1.5m accuracy for a basic system, and this is sufficient for yield mapping.
As there is time taken for the harvested almonds to pass from the pick-up through to being thrown from the harvester into the reservoir cart there is an inherent lag in time from the GPS antenna relative to discharge.
This lag can be accounted for using a time- or distance-based offset to achieve more precise positioning.
Without this correction there can be small offset in the yield data.
Along with the position data, the GPS signal also provides heading and time data which can be stored with each point of yield data.
Speed
While GPS receivers can compute travel speed, when operating at slow speeds, due to the positioning errors of ±1.5m there is a speed variation of ±3km/h (even when stationary).
To eliminate this error during yield mapping, it is best to use a sensor attached to one of the harvester wheels which measures the speed of wheel rotation.
When a wheel sensor is triggered by a magnet, it is recommended that several magnets be placed evenly around the wheel.
An example from the 2024 harvest (160 hours of harvesting at Murtho, SA) of the variation in speed from GPS compared to a wheel sensor is shown in Figure 2.
The large variation in GPS speed below 15km/h shows why using GPS speed for yield calculations is not viable.
The graph shows no wheel speed data for travel less than 0.5km/h.
This is due to the wheel speed needing to be above 0.5km/h to trigger the recording of yield map data.
Variety
Often almonds in an orchard are planted with a main variety (for example, Nonpareil) on every second row and with two different pollinator varieties, with one of these varieties on each side.
Thus, each row in the orchard is used to pick up two varieties of almonds.
To make yield comparisons, it is best to store the variety being harvested with each point of yield data.
Yield (percentage flow)
The work presented in this article used a rotating LiDAR sensor.
It rotated at 10 revolutions per second and sent out a rotating light beam.
The LiDAR measured the distance to the nearest object at approximately one-degree increments of its rotation.
For each angular increment the LiDAR sensor computes the distance to any object that passes the light beam.
If the distance is in the range where an almond would be passing, the yield mapper console considers the position as detecting an almond.
If not, the console considers the position as no almond.
A five-second duration has been found as a useful time to average and record yield data.
When travelling at 3km/h, those five seconds equate to 4.2m of travel along the row.
To gain a value of almond flow, the number of times the LiDAR sees an almond, divided by the total number of measurements in the detection range, is computed.
Thus, the raw almond flow data is recorded as a percentage.
During the 2024 harvest, an almond harvester (Flory 8600) at Murtho recorded 115,000 five-second intervals of harvest data (160 hours) and during this harvest the LidAR flow sensor registered almond flows of 20 per cent to 90 per cent (see Figure 3).
The main harvest was undertaken in the first 76,000 readings and the harvest of re-shakes is after 76,000 readings with lower flow percentage values being recorded.
The percentage flow values close to zero are for travel over the headlands, missing trees and travel to/from the orchard.
Yield (kg/m)
The yield as a value of kg/m can be gained through calibration using known mass data and the value of percentage flow divided by the speed.
At the Almond Board of Australia’s Almond Centre of Excellence (ACE) the almond harvester (Flory 7488) was fitted with an Ag-IQ Almond Yield Mapper and a set of scales to measure trial plot yields (Figure 4).
During 2024, the whole ACE site was yield mapped.
Some of the plot data was made available for this work.
The ABA data showed yields ranging from 2kg/m to 10kg/m along the row.
The ABA harvested their crop at a speed of around 1.5km/h, which gave LiDAR flow percentages ranging from 12 per cent to 45 per cent.
The results of two days of harvest (close to 100 plots) are shown in Figure 5.
This shows a linear relationship between yield per metre with almond flow divided by speed (uncalibrated yield per metre).
Yield (kg/ha)
Once the yield per metre is calibrated the yield can be determined as yield per hectare.
Yield per ha = (yield per m) x (100/half the distance between rows (m))
Plotting yield data
There is free software available to plot yield maps from a file of data.
One such software is QGIS (www.qgis.org/en/site/) and with a small amount of instruction it is quite quick and easy to create yield maps.
An example of a yield map collected in 2024 of the Murtho site for Carmel almonds is shown in Figure 6.
At the time of submitting this article the data was calibrated using the ABA harvester calibrations.
The map shows the regions of high and low yields using a range of colours.
This data can be used to correlate with orchard health and practices with the aim of lifting orchard production.
Further information
More information is available at www.Ag-IQ.com or contact at John.Fielke@bigpond.com or 0407 676 190.