A new data visualisation tool can display the distribution and severity of pesticide resistance across Australia, enabling growers and agronomists to make better, data-driven crop management decisions relevant to their region.
The Pesticide Resistance Integrated Mapping (PRIM) tool was developed through the Analytics for the Australian Grains Industry (AAGI) program.
Fungicide resistance in PRIM currently involves four key pathosystems – all recognised challenges for Mallee croppers – including wheat septoria tritici blotch, wheat powdery mildew, and barley net-form and spot-form net blotch, with plans to expand into other pathosystems in the near future.
Produced by the Centre for Crop and Disease Management (CCDM) in collaboration with geospatial technology company NGIS, the first release of the PRIM tool visualises the spatial distribution of fungicide resistance data, with potential to expand to other data including herbicide and insecticide resistance monitoring and biosecurity issues.
CCDM director Professor Mark Gibberd said the simple web-based app is the first of many exciting research outputs to come from AAGI to give growers the help they need to make the most profitable decision around crop and chemical use.
“We feel it could really make a positive difference to current farming systems,” Professor Gibberd said.
“PRIM is one of the first key outputs to come from AAGI and is an example of how this major national research initiative can come up with data analytics solutions to challenges faced by growers.
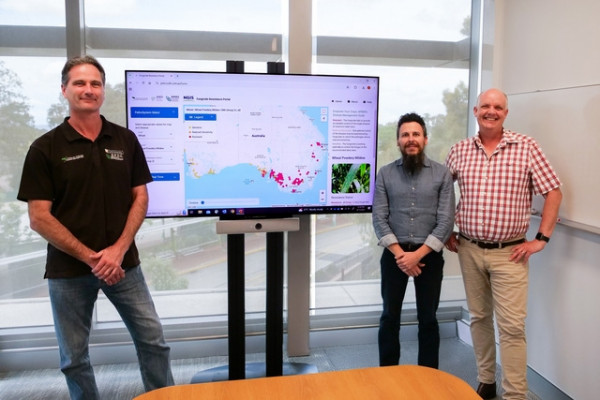
“In its first release, PRIM has enabled an enormous database of CCDM’s fungicide resistance testing results to be visualised in a map, showing fungicide resistance is indeed everywhere, with various levels of severity across the country.”
NGIS general manager Matt Stewart said developing PRIM into a simple, web-based app has been a fantastic accomplishment, using major fungicide resistance datasets with associated GPS data to build a map that displayed resistance distribution of de-identified results.
“And it’s promising to think this data visualisation tool is only in its early stages, with potential to visualise all sorts of agricultural data. As more data is entered into the system, the more accurate the tool gets, and the less guesswork there is for growers,” he said.